The Latvian Council of Science has developed and published a new interactive dashboard for the Fundamental and Applied Research Programme (FLPP). Available in the Power BI environment, the dashboard provides a comprehensive, transparent and user-friendly overview of FLPP calls and project data since 2018. The tool enables researchers, universities, policymakers and the wider public to customise and analyse data across multiple dimensions, revealing key trends in the development of research in Latvia.
Comprehensive Data Exploration in One Place
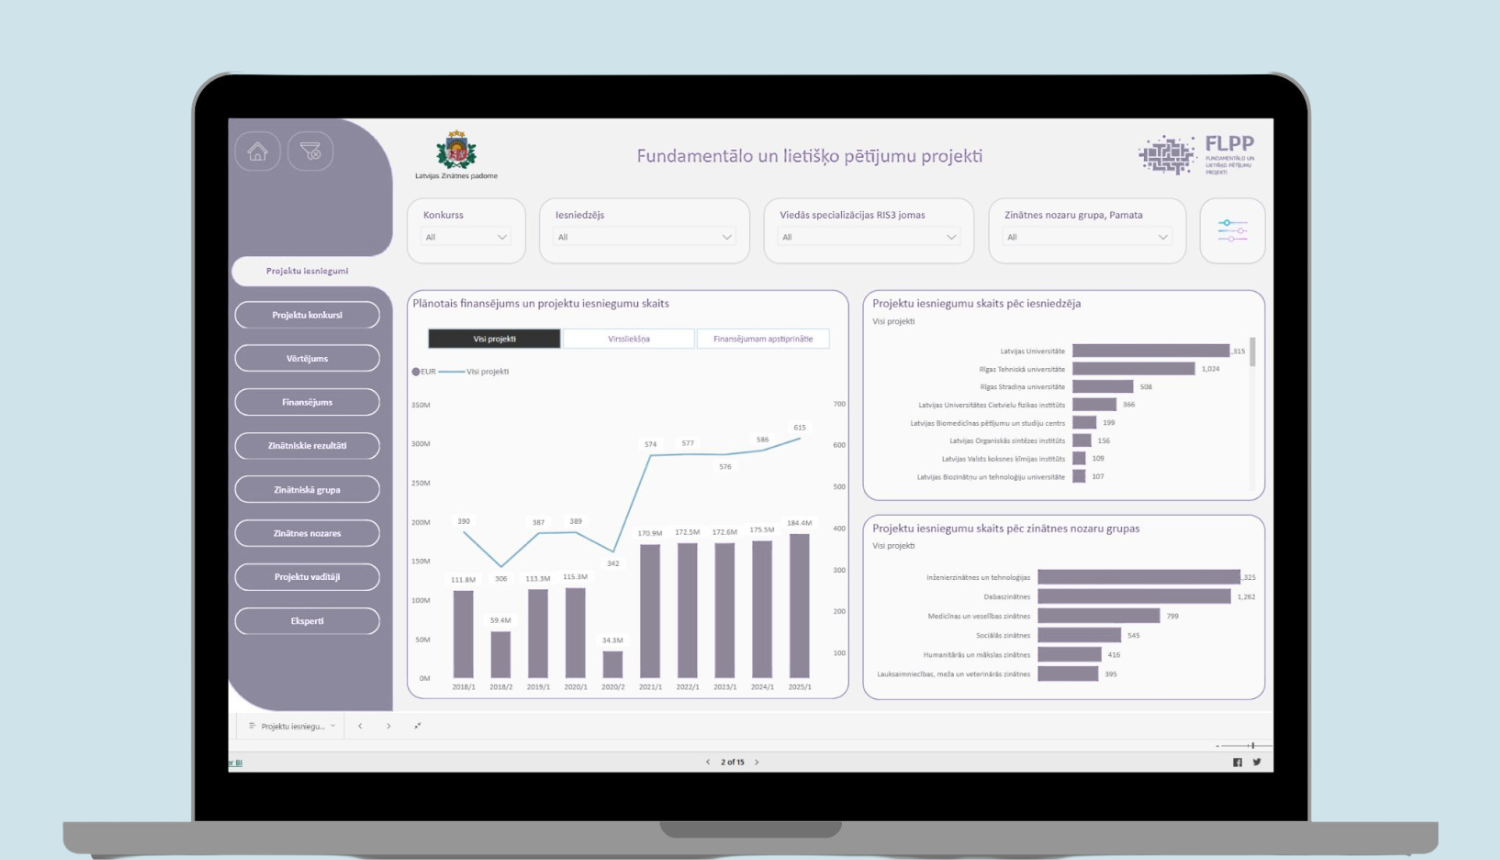
The interactive dashboard brings together detailed information on calls and project applications, as well as on implemented projects, project leaders, institutional participation, funding and achieved results. Data are available starting from the lzp-2018/1 call, with a broader dataset covering calls from 2021 onwards.
The dashboard allows users to explore information on:
- call performance indicators and the number of project applications,
- projects evaluated above the quality threshold and projects funded,
- participation and success rates of research institutions,
- distribution of projects by scientific fields and Smart Specialisation (RIS3) areas,
- requested and allocated funding,
- planned scientific outputs and resource involvement,
- profiles of project leaders and experts (gender, career stage, country representation).

The “Implemented Projects” section of the dashboard provides detailed information on each completed project, including its title, summary, keywords, institutional involvement, use of funding, key results, as well as links to the project description and its impact report.
Customised Data, Filtering and Visualisation
The tool offers extensive filtering and selection options, allowing users to view data from perspectives most relevant to their needs:
- by call,
- by research institution (applicant or partner),
- by scientific field group and discipline,
- by RIS3 area,
- by type of research (fundamental or applied),
- by interdisciplinarity and inter-institutional cooperation,
- by project leader gender and career stage.
These features enable users to:
- analyse individual calls or compare multiple calls,
- track trends in institutional participation and performance,
- identify developments within specific scientific fields,
- easily visualise data for presentations, strategic planning or internal analyses.
A Dynamic and Evolving Tool
The interactive dashboard will be updated on a regular basis – following each call, after the conclusion of contracts for new projects, and after the evaluation of completed projects. The Latvian Council of Science also plans to gradually expand the scope of available information and further enhance the dashboard’s functionality.